Archive for September, 2009
China’s Demographic Transition and its Population Policy
Sep 30th
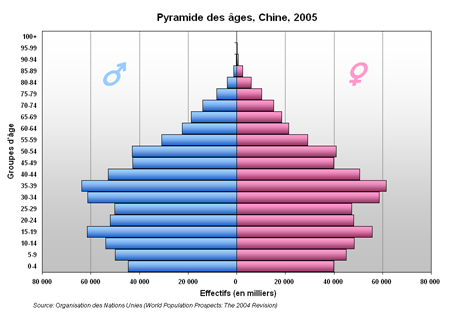
[Source: commons.wikimedia.org Author fargomeD License GNU Free Documentation License]
A population pyramid (or age sex structure) often tells a story. Detective Discussion points:
- What are the unusual features of the above age-sex structure?
- Can you suggest possible reasons?
So how might this story look if we plotted the birth rates and death rates on the same line graph, over time – in other words China’s actual demographic transition.
Click the thumbnail below to see the graph in full (source unknown).
The extreme demographic events of 1958-1961 can be understood by viewing the following 5 minute clip:
Interested the discussion points above? Read more details at the following excellent page by geographyfieldwork.com:
The One Child Policy
[Source: opengecko.com]
The next steps of this learning activity concerns the well-known one-child population policy first introduced in 1979. You can follow the activities on the following link from here:
Population Policies at geographyalltheway.com
To gain more understanding of the impact of the population policy you can watch this ten minute video:
The main things to be aware of are:
1) Why was the policy introduced?
2) How did the policy work?
3) What were the successes of the policy?
4) What were the problems with the policy?
Some other websites can help here. As always, reference any sites you refer to.
Wikipedia on the One Child Policy
geography.about.com on China’s One Child Policy
BBC News Article asks Has China’s one-child policy worked?
Time.com on China’s One-Child Policy
Very recent news at time of writing this post:
MailOnline has an article called ‘One-child China is a success, says Labour aide Adair Turner’
Any Google search for key words china one child will reveal masses of information. Always try to be aware of bias in the websites you access.
Market Economies
Sep 30th
[Source: flickr.com Image by Concrete Forms Some rights reserved]
All economies need to answer the three basic questions which result from the fact of scarcity:
- What to produce
- How to produce
- For whom to produce
For a market economy, we need to research the following:
a) How it works – how does it answer the three basic questions above?
b) Advantages of this economic system
c) Disadvantages of this economic system
d) Examples covering the three above points
Note: It is important to be able to compare this economic system to that of command (or planned) economies (– see previous post).
Some useful ’starting point’ web sites follow:
Economywatch.com on Market Economies (possibly sourced from elsewhere)
The Free Dictionary on Market Economy
‘Market Economy Totally Explained’
Is a free market "free" if it’s regulated? (How Stuff Works)
A video on Free Market Economies can be viewed here (source: videos.howstuffworks.com)
From the same site, a video comparing market economies to command economies.
Investigating and Presenting Problems in the Brazilian Favelas
Sep 29th
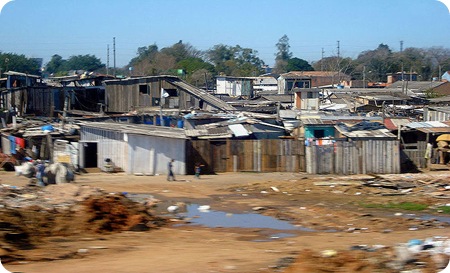
[Photo source: http://commons.wikimedia.org/wiki/File:Favelas-portoalegre.jpg Author: Tetraktys]
Your overall tasks are to:
1) Find out about some of the problems experienced by people who arrive in the shanty towns in Brazil’s large cities
2) Create a photo movie to show these problems experienced by people.
These tasks should be completed over the course of one lesson and two home-works.
Part 1 – Researching some of the problems of life in the Favelas.
I recommend you use the lesson for this part – the photo video can be tackled as homework once you’ve finished the research.
Make notes of the conditions found in the favelas, and the problems which people experience as a result of living there. Make notes under the following headings:
- Housing
- Employment and Income
- Health
- Education
- Population
- Facilities and Infrastructure (Electricity and Water supplies, etc.)
- Transport
- Other
You will get your information from the following web sites.
1) A flash game called ‘Favela Kid’ (source: www.sportrelief.com). As you play this game, be sure to add notes under the headings above – be observant – don’t just rely on the text – what do the graphics show?
2) A flash animation showing how Brazilian shanty towns change over time (source: http://www.sln.org.uk/geography/)
3) Some more complex but informative text on favelas (source: http://www.macalester.edu/courses/geog61/chad/)
4) Your own research on favelas (start with a search engine such as Google). If you use any other websites, make sure you write them down in full.
Part 2 – Presenting the problems of life in the Favelas.
For this we are going to use an online photo animation website called animoto. This is an excellent resource for making photo based videos.
By the time you read this, your teacher will hopefully have contacted you with an animoto email address which you can use to sign up with.
UPDATE – Further details will be set on homework database – no need to start the animoto activity within the lesson itself – focus on Part 1 only.
Command (or Planned) Economies
Sep 23rd

Image by bobster855 (flickr.com Some rights reserved )
All economies need to answer the three basic questions which result from the fact of scarcity:
- What to produce
- How to produce
- For whom to produce
For a planned economy, we need to research the following:
a) How it works – how does it answer the three basic questions above?
b) Advantages of this economic system
c) Disadvantages of this economic system
d) Examples covering the three above points
Some useful ‘starting point’ web sites follow:
Wikipedia on Planned Economies
enotes.com on Planned Economies
Fact Archive on Planned Economies (probably from various sources)
BBC News on North Korea (one of the last planned economies?)
Population Pyramids – Part 1
Sep 23rd
Before moving on it is worth recapping the Demographic Transition model:
Now we compare population structures (also known as age-sex structures or ‘population pyramids’) between MEDCs and LEDCs. The following animation should make sense before moving on:
BBC Scotland Education Population Pyramid Flash Animation
Now download the following worksheet and follow the instructions:
Worksheet – Population Pyramids on the Net
Now visit here and repeat the quiz until you can score full marks:
http://www.geography.ndo.co.uk/populationmatch.htm
Putting it all together – watch this:
You should also be able to complete the second set of tasks (already introduced in the Demographic Transition Model post) – click on the Part 2 tab and check your Answers before moving on – not there are three pyramids to analyse.
http://www.ngfl-cymru.org.uk/vtc/demographic_trans/eng/Introduction/plenary.swf
Review:
Read the following pages carefully. Add notes where appropriate.
BBC Bitesize for Population Structure Revision [1]
BBC Bitesize for Population Structure Revision [2]
At the bottom of the last page you can take a test bite.
Dependency Ratios
This module helps with our understanding of dependency ratios:
Understanding Population Change Over Time
Sep 16th
Recapping some key words … can you define the following:
- Birth Rate
- Death rate
- Natural Increase
- Natural Decrease
First, use the above slideshow to revise some reasons for high and low birth and death rates.
You should make a table to summarise these causes of high and low birth and death rates.
Now we turn to a model based on how both birth and death rates have changed over time in European countries (especially the UK). This is the Demographic Transition Model.
Discussion points:
Q. What does ‘demographic’ mean?
Q. What does ‘transition’ mean?
Q. What does ‘model’ mean?
Source: geographyalltheway
Visit this page from www.geographyalltheway.com:
The Demographic Transition Model
Complete the worksheet on the above page.
Finally, review your understanding here (you only need to complete Part 1):
http://www.ngfl-cymru.org.uk/vtc/demographic_trans/eng/Introduction/plenary.swf
World Population Growth
Sep 9th
We are thinking about how the world’s population (and different countries / continents’ population) is changing and why.
First a snap shot
An excellent link to show estimated births and deaths (as well as CO2 emissions) across the planet – click on it to view in full:
http://www.breathingearth.net/
How has the world population changed in your lifetime?
Use the following animation to explore some key facts about changes in your lifetime:
The World Population and Me [INED Institut National Etudes Démographiques]
Population Growth
This clip gives an interesting view of population change across the world over time since year 1 AD and projected to 2050. Watch it and consider why some places become more densely populated at key times in history. Consider, too, where the majority of population increase has taken place in the last 50 or so years. Finally, do you think this is a realistic presentation of population change? Be prepared to justify your answer.
Now we look at the following series of animations:
How will the world population change in the future? [INED Institut National Etudes Démographiques]
We move on to consider some of the factors that affect birth rate (make sure you can define birth rate):
Births and Family Size [INED Institut National Etudes Démographiques]
Make sure you visit all of the four explanations on the above animation.
While birth rates are changing, so too are death rates. Linked to death rates is the average length of people’s life. If the death rate is falling, people on average are living longer. Watch the following animation:
Understanding length of life [INED Institut National Etudes Démographiques]
… more to follow …
This quick quiz reveals some interesting facts …
http://ourworld.ca/ow2002/quiz02/archives/flashquiz/populatf.html
Now we need to consider what causes population to change …


