James Penstone
This user hasn't shared any biographical information
Posts by James Penstone
Site and Situation and Ordnance Survey Maps
Mar 11th
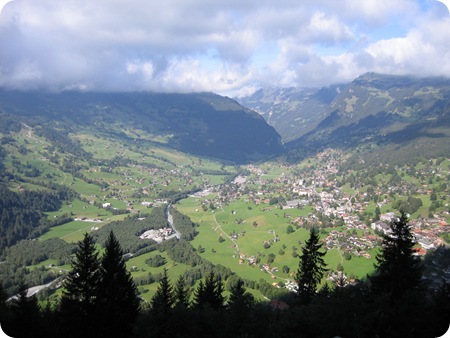
Image source: opengecko.com
The site and situation of a settlement are really important to understanding (a) why the settlement was located in a particular place in the first place and (b) whether or not the settlement was likely to grow over time.
You need to understand:
- the difference between the terms "site" and "situation"
- different factors affecting the site and situation of a place (usually, we think about the needs of the original settlers. In many parts of the world, we have to rewind many hundreds of years, and think about what people would have been looking out for when they decided to build a small settlement somewhere).
- how to recognise these factors through a map such as an ordnance survey map commonly used in the United Kingdom
First check your understanding by visiting these very useful web pages:
Settlement – Site and Situation at GeoBytesGCSE
GCSE Bitesize – Settlement Site and Situation
Geography GCSE: Settlements Site and situation – S-Cool
For some real examples, you could explore the middle ‘Site and Situation button’ here:
http://www.mrdgeography.com/Urban%20Geo/Urban_Geo.swf
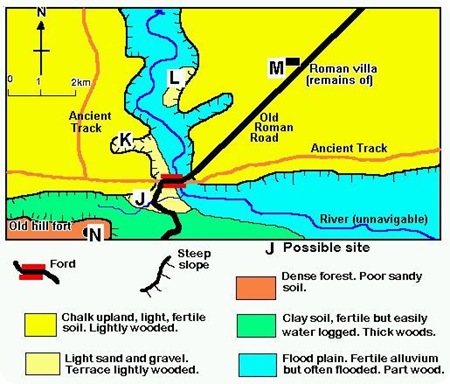
For a quick activity to check your understanding you could try evaluating the following sites on this imaginary map in terms of which might be better than others for locating a settlement. Make sure you can give reasons why.
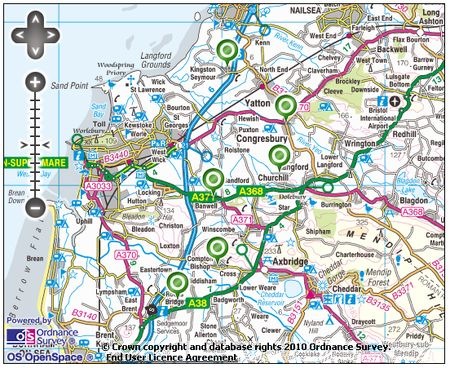
Now you could select a map (such as an OS map). A good example can be found in this area below, comparing six villages (near to the green dots). Click on the image below to take you to an interactive OS map on a separate page. Note that you can zoom in and out:
To help you evaluate different settlements’ site and situation factors, you can use the following framework. Note that this includes reference to ‘morphology’ which you may or may not have covered yet. If you have not covered settlement morphology (shape) yet, you can leave this out.
A direct link to this document for print (and save as pdf) is here:
Table to evaluate 6 settlements’ Site and Situation
When completing this table you should include as much information as possible. If the settlement does well under any heading, say why and give map evidence (including grid references). If you think the settlement would not score so highly on any row, again say why, and give good reasons. Finally, you may like to view the same area using a Google map with satellite view. Again, you can zoom in and out:
View Weston-Super-Mare Environs Site Situation Settlement in a larger map
Sand Dune Processes
Feb 22nd
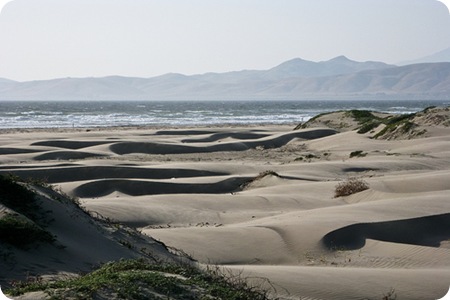
Photo from flickr.com by mikebaird [Some rights reserved]
The IGCSE Syllabus requires us to understand this:
Describe and explain the landforms associated with these processes. You should study the following coastal landforms:
□ coastal sand dunes
The action of wind in shaping coastal sand dunes should also be understood.
Here are four good websites to help you achieve this understanding:
Coastal Sand Dunes on Offwell Woodland and Wildlife Trust
BBC Scotland Higher Bitesize on Sand Dunes
Uses of the Amazon Rainforest
Feb 1st
How are people using the rainforests?
You need to choose one of these groups who are using the Amazon rainforest in some way:
a) Amazon indians (e.g. Kayapo Indians)
b) Miners of Iron Ore (e.g. at the Carajas Iron Ore Mine)
c) New Settlers (also known as colonists or colinistas tehse are farmers who were given land by the government this happened a lot ion the 1980s)
d) Cattle Ranchers
e) Conservation Groups
f) The Government responsible for Transport (e.g. the Trans-Amazonian Highway)
g) Loggers
h) The Government responsible for Energy (e.g. new Hydro Electric Power Stations)
Your mission is to create a truly awesome slideshow with an absolute maximum of three slides and a minuimum of one slide to explain:
1) How these people are using the rainforest and why they use it this way.
2) Examples of where these people are using the rainforest and for how long – maps / satellite images would obviously help
2) Difficulties this might have caused
3) Possible solutions for the future
The slideshow has to be very visual with images, facts and figures – you are using the slideshow software to its full potential. We are not interested in text heavy information. This will be shown at the start of a lesson. You can include hyperlinks to websites if people want to learn more.
Obviously you will need to research this thoroughly, and the internet is an obvious resource.
Output, Costs, Revenue and Profit
Feb 1st
[Image: nDevilTV  Some rights reserved]
The Cambridge IGCSE syllabus requires us to have a good understanding of the following:
We have seen useful videos on YouTube before, particularly MJMFoodie’s very visual explanations (which are often aimed at higher stages of education, such as IB). One of her useful videos (on fixed and variable costs) is here:
Another useful video by MJMFoodie gives an introduction to the topic and explains the idea of the law of diminishing returns.
A great idea for a learning activity to really understand this topic is for you to work with one other person towards producing your own video, MJMFoodie style. It should be simple – create a PowerPoint (or similar) with images. These images can be your own that you have drawn on the computer, scanned into the computer, or other images produced by other people. It is obviously preferable to use images that are not copyrighted, so some good places to visit for non-copyright images are here:
http://www.everystockphoto.com/
http://search.creativecommons.org/
As you assemble your slideshow, make sure you are working on your script to go with each slide. Later on you will want to record your voiceover while playing the slideshow. In that case, planning the video out is essential and you should start with your partner by story-boarding the video.
Your video should summarise this theory on costs, revenue and profit as outlined in the syllabus above. It should summarise it in a highly visual and accessible way. Your video should ideally last somewhere between 5 and 10 minutes.
A good starting point is to consult the relevant chapter in the text book you are using. A good text book is this one, which introduces the idea using Sue’s Teddy Bear Firm.
 |
Economics: A Complete Course for IGCSE and O Level: Endorsed by University of Cambridge International Examinations |
Other simple summaries of aspects of this topic are found here:
Tutor2U – Simple Overview of Output, Fixed Costs and Variable Costs
Tutor2U – Simple Overview of Revenue, Costs and Profit
Tutor2U – Simple Overview of Average Costs and the Scale Of Production
Market Failure
Nov 27th
These YouTube clips help us to understand some of the ideas to do with Market Failure. Some of the ideas in the first clip are not needed for IGCSE understanding (adverse selection and moral panic).
1) General understanding of Market Failure
2) Negative Externalities Explained
Note this uses Marginal Costs and Marginal Benefits curves. Marginal Benefits is the same as the Demand Curve. Marginal Costs is the same as the Supply Curve.
3) Public Goods
Darfur, Sudan – Crisis
Nov 4th
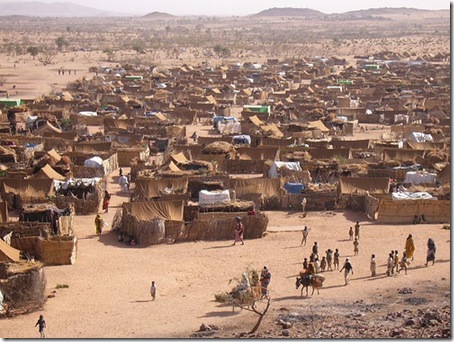
Uploaded on November 25, 2005 by mknobil Some rights reserved
Create a case-study document about the crisis in Darfur using the following resources:
1) The Guardian – Photo/Audio summary of the crisis.
2) Map-based interactive GIS to show the geographic situation.
Equilibrium Price – How do The Laws of Supply and Demand Interact?
Oct 26th
Good recap video:
Good overview video:
Activity: Recapping Factors Affecting Demand and Supply
Econedlink Site
Activity: Exploring changes in Supply and Demand
Activity: How changes in Supply and/or Demand affect Market Equilibrium
More sophisticated diagram analysis of teh same issue
Activity:
Activity: Changes in Supply and Demand Effect Equilibrium Price and Price Ceilings and Price Floors. Click here:
Transition Economies
Oct 7th
[Source: flickr.com Image by sludgegulper Some rights reserved]
According to the International Monetary Fund (2000) the following economies can be categorised as making the transition from command to free market economies in recent history.
Transition economies in Europe and the former Soviet Union
CEE
Albania, Bulgaria, Croatia, Czech Republic, FYR Macedonia, Hungary, Poland, Romania, Slovak Republic, SloveniaBaltics
Estonia, Latvia, LithuaniaCIS
Armenia, Azerbaijan, Belarus, Georgia, Kazakhstan, Kyrgyz Republic, Moldova, Russia, Tajikistan, Turkmenistan, Ukraine, UzbekistanTransition economies in Asia
Cambodia, China, Laos, Vietnam
Source: Transition Economies: An IMF Perspective on Progress and Prospects (2000)
Use your text book and the web to find out what a transition economy is in theory. Then, having selected one of the above, work in a pair to research a real life transition economy. Your 3 specific goals are to:
1) Evaluate how well the economy fits the general theory behind transition economies. Make sure you use headings from the theory to structure this aspect of your research.
2) Evaluate the impact of the transition on different stakeholders (groups of people) – for example: firms, low income groups, high income groups, other nations, the government.
3) Evaluate the transition in terms of both the short term and long term consequences on that economy.
A very tongue-in-cheek comic take on transition economies can be seen here:
China’s Demographic Transition and its Population Policy
Sep 30th
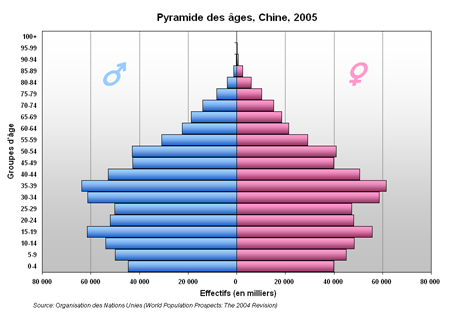
[Source: commons.wikimedia.org Author fargomeD License GNU Free Documentation License]
A population pyramid (or age sex structure) often tells a story. Detective Discussion points:
- What are the unusual features of the above age-sex structure?
- Can you suggest possible reasons?
So how might this story look if we plotted the birth rates and death rates on the same line graph, over time – in other words China’s actual demographic transition.
Click the thumbnail below to see the graph in full (source unknown).
The extreme demographic events of 1958-1961 can be understood by viewing the following 5 minute clip:
Interested the discussion points above? Read more details at the following excellent page by geographyfieldwork.com:
The One Child Policy
[Source: opengecko.com]
The next steps of this learning activity concerns the well-known one-child population policy first introduced in 1979. You can follow the activities on the following link from here:
Population Policies at geographyalltheway.com
To gain more understanding of the impact of the population policy you can watch this ten minute video:
The main things to be aware of are:
1) Why was the policy introduced?
2) How did the policy work?
3) What were the successes of the policy?
4) What were the problems with the policy?
Some other websites can help here. As always, reference any sites you refer to.
Wikipedia on the One Child Policy
geography.about.com on China’s One Child Policy
BBC News Article asks Has China’s one-child policy worked?
Time.com on China’s One-Child Policy
Very recent news at time of writing this post:
MailOnline has an article called ‘One-child China is a success, says Labour aide Adair Turner’
Any Google search for key words china one child will reveal masses of information. Always try to be aware of bias in the websites you access.
