
Applied Macroeconomics – Evaluating Demand Side Policies
Nov 2nd
Aims:
· To recap the Paper 1 Mark Scheme
· To revise learning on the macroeconomic equilibrium, Keynesian and neoclassical perspectives and demand side policies.
· To apply the above learning to examples, both theoretical and real-life.
· To develop critical analysis and evaluation skills.
Step 1 – Recap Exam Technique
· Remember the Paper 1 Mark Scheme
· Remember the tips on evaluation
Step 2 – Analyse a Theoretical Scenario.

Image: Some rights reserved by APMus
You should ideally work in a pair or three and, as a team, will analyse the likely macroeconomic impacts of one of the following scenarios.
1) Government announces a large increase in spending on health and education.
2) Chancellor announces tax exemption scheme on new investments for small to medium sized firms.
3) Average wage rises way above inflation for the third month running.
4) Exchange rate appreciation knocks export hopes for manufacturing.
5) Institute of Directors (IOD) latest survey shows clear signs of optimism for the future of the economy
6) Central Bank signals rise in interest rates of ½%
- You should include at least one diagram.
- You should evaluate the likely effects – how strong will the impact be?
- There may not be one single answer – you simply need to be able to justify your predicted outcomes. Evaluation often needs to look at the assumptions we start with – you should be clear about what you are assuming.
Prepare a presentation (using for example Google Docs Presentation on MS Powerpoint) and prepare between two and four slides to show and explain the effects.
Step 3 – Analyse a Real Life Scenario.

Image: Some rights reserved by RambergMediaImages
You ideally need to form different pairs / threes in which you will be able to offer feedback to each other.
Each pair focuses on a region of the world, and each person selects a separate and current headline and article related to a demand side policy that has been introduced by the government there.
· North America
· South America
· Europe
· Africa
· Asia (not Thailand)
· Thailand
You need to summarise:
· Why there was a need for the demand-side policy
· The likely impact and successes / shortcomings of the policy.
· Include reference to at least one diagram
Try to use all of the techniques needed for a top scoring evaluation based essay.
Create a Google doc (or some similar document) that you will share with your partner(s).
A suggested site to search on: http://news.google.co.uk/
Here is the evaluation spreadsheet to provide feedback with. Make a copy and share it with your partner to offer them feedback with.
Aggregate Supply and Macroeconomic Equilibria
Nov 1st
This title refers to a lot of theory which it is worth having explained to you first by a teacher of Economics. Having looked at Aggregate Demand, we now introduce Aggregate Supply which gets a bit complicated with two different schools of thought, and we also need to refer to three possible different equilibrium situations (at full employment, the deflationary (or recessionary) gap and the inflationary gap). Equilibria is simply the plural of equilibrium.
Here are the syllabus requirements:
• Aggregate supply
a) short-run
b) long-run (Keynesian versus neo-classical approach)
• Full employment level of national income
• Equilibrium level of national income
• Inflationary gap
• Deflationary gap
Make sure you can define each of these as well as explain them.
To recap on inflationary and recessionary (deflationary) gaps, refer to this video by ACDCLeadership but note that it explains it from a neo-classical perspective. He then goes on to explore fiscal and monetary policy responses, which we will explore in more detail later, but is worth watching now.
A quick and very useful summary of some of the key differences is given by ACDCLeadership in his video Classical vs. Keynesian Aggregate Supply- Macroeconomics. He is delivering this to an AP audience (as opposed to IB). Notice that he combines Keynesian, Intermediate and Classical ranges into what we can simply think of as the Keynesian AS curve.
This next clip could also help understanding already reached in class / revised through the text book.
pajholden on Keynesian Vs Monetarist on the LRAS curve
He refers to those holding the neo-classical perspective as ‘monetarists’. Good for understanding how the market for labour is understood under each perspective. Notice the simplified (original) Keynesian AS curve which he starts off with for the Keynesian perspective.
http://www.youtube.com/watch?v=QG56sFoNNa8
BrynJonesOnline on Aggregate Demand & Aggregate Supply
Notice that his AS curve is very similar to the Keynesian version. So he assumes a Keynesian perspective (without saying it), and it is good for showing the three different phases / segments along it. Note that at 2 minutes 10 seconds, he is now mentioning supply side bottle necks (again without actually saying it). For now, you do not need to view any further from 2 minutes 45 onwards (after the interlude) as he now moves on to AS changes – (a) increased costs and (b) successful supply side policy which we explore later.
From http://reffonomics.com, this slideshow also combines the Keynesian and neoclassical perspectives on to one graph whereas we have preferred to keep them separate. However, this is very good for getting the history of thought behind these two perspectives, including the name of influential economists, and for seeing the simple differences between the Keynesian and Neo-classical view of AS. Note also that they put Yfe (Full employment level of national income – what they say is 97%)) at the vertical segment whereas some text books prefer to think of that as the maximum level of employment (100%).
Click here: Aggregate Supply Ranges
Finally, from the same website, this slideshow is excellent for summarising where we are and indicating where we are headed next with possible government policies
Aggregate Demand Part 1
Nov 1st
Relevant Syllabus Points:
3.3. Macroeconomic Models: Aggregate demand—components
3.4 Demand-side and supply-side policies: Shifts in the aggregate demand curve/demand-side policies [fiscal policy, interest rates as a tool of monetary policy]
Questions:
- What is Aggregate Demand?
- What are the components of Aggregate Demand?
- What shape does the curve have and why? How are the axes labelled?
- What causes a movement along the AD curve?
- What factors affect Aggregate Demand, causing it the curve shift? Categorise your answers under the four main components. Give examples and show the effects in diagrams.
Overview of the Aggregate Demand Curve:
CuteChadz gives a 2 minute overview. Note that figures given are UK based and the 2nd bullet point on Consumption is a bit confusing and so can be ignored:
mjmfoodie on AD and AS. Watch the first 4 minutes (we can use the last 1 and a half minutes later when we cover Aggregate Supply)
Why does the Aggregate Demand Curve slope downwards?
econsteve12 gives quite a thorough and clear explanation here:
Reffonomics on Slope of Aggregate Demand
What factors affect aggregate demand?
CuteChadz gives a 10 minute overview, referring to such things as loose, tight, fiscal, and monetary policy.
Specifically, what influences Consumption, the main component of AD?
pajholden gives a 7 minute 15 seconds overview:

Supply Revisited
Oct 25th
This post is to add further resources on the concept of supply, for those who wish to follow up on this absolutely essential concept in Economics. First, however, I recommend you use the resources on this post to learn about supply: http://opengecko.com/economics/supply/
1) Videos
Supply by vaacon1
Creating a supply curve from a supply schedule by FreeEconHelp
Supply Curve and Changes in Supply by jcsballoon
Change in supply / change in quantity supplied by vaacon1
Various factors (short clips) affecting supply by vaacon1:
The diagrams are quite hard to see on the whiteboard, but the explanations and examples are clear.
Supply shifts – Prices of Relevant Resources
Supply Shifts – Expectations of Future price
Supply Shifts – Number of Sellers
Supply Shifts – Technology
Supply shifts – Taxes and Subsidies
You will need to revise what taxes and subsidies are.
Supply shifts – Government Restrictions
2) Interactive Activities

Factors affecting supply (via http://www.mbs.edu)

Supply via http://yknot.terapad.com

Supply – sellers perspective via http://edunirvana.com

Graphing The Supply Curve via http://glencoe.com

The Law of Supply and Supply Curves via http://www.emcp.com

Demand Revisited
Oct 25th
This post is to add further resources on the concept of demand, for those who wish to follow up on this absolutely essential concept in Economics. First, however, I recommend you use the resources on this post to learn about demand:
1) Videos
What is a demand curve? by 
Note – I think part of his second to last sentence should state “… the basic relationship between quantity demanded and changes in price …”
Deriving a demand curve, given a demand schedule by FreeEconHelp
Demand curve video by jessicaweldon22
Note – at one point she claims the market is the whole planet’s population, but we can talk about more specific, smaller markets than that. E.g. the market for cars in Thailand.
The Demand Curve Part 1 by milespritchardecon1
The Demand Curve Part 2: Shifts In Demand by milespritchardecon1
Change in demand / change in quantity demand by vaacon1
Various factors (short clips) affecting demand by vaacon1:
The diagrams are quite hard to see on the whiteboard, but the explanations and examples are clear.
Demand shifts – prices of related goods
Demand shifts – expectations of future prices
Demand shifts – Income
Demand shifts – Number of buyers
Demand shifts – Preferences
As he adds, in text, part way in, he makes a mistake early on and mentions shifts in supply, when he is actually discussing shifts in demand.
2) Interactive Activities

A Demand Curve (imperial.ac.uk)


Animated Economics – Demand Curves

John Wiley Economics – Shift Versus Movement Along The Demand Curve

Demand by yknot.terapad.com

Graphing The Demand Curve (glecnoe.com)

Increase / Decrease in Demand by BlackBoards.com

Tariffs, Quotas and Subsidies
Oct 23rd
These three types of protectionism have pretty tricky diagrams (or at least they can get tricky if we want to really get into how they work in terms of the impact they have on different groups or stakeholders. Note – we should want to get tricky if we want to do well at IB Economics ![]() ). Here is a round up of resources to help you understand their effects.
). Here is a round up of resources to help you understand their effects.
Remember to first find a good working definition of each of these types of protectionism. Go on … Google them ![]()
An overview of the three types is here, although the ‘Next’ function does not work.
There is an excellent summary of the relevant theory here by Evan Schmidt on his impressive blog (http://schmidtomics.blogspot.com/)
Tariffs
Here’s what a diagram might look like. It gives a good idea of the complexity of the diagram:
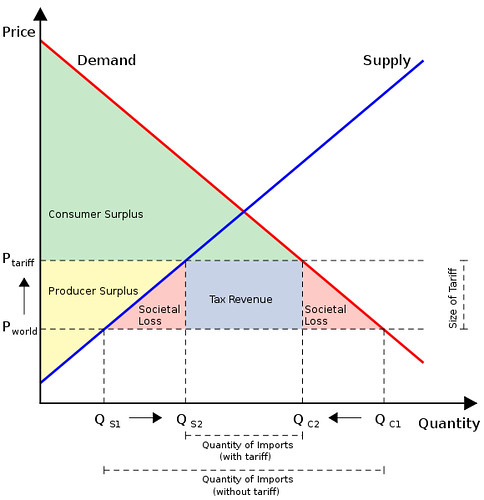
Image: Some rights reserved by Gaynoir_
However, I recommend you refer to ‘welfare loss’ instead of ‘societal loss’ – whatever the term you use, these pink triangles represent inefficiency. I also recommend you use letters for the different ‘shapes’ rather than colours, as that is far more efficient to complete in an exam and to refer to in your text which you use to explain the diagram. This diagram below uses letters, but note, you can (should) still get even more sophisticated than this – check your IB Economics text book if you have one.

Image by Ratibgreat on wikipedia
This first video by lostmy1 is a simple explanation compared to the following videos, but it is very accessible. It does not tackle efficiency / consumer and producer surplus, and these are concepts which you should then try to understand from the subsequent videos.
This next video by economicsfun is a very good explanation. The second half moves on to analysing in terms of theoretical numbers, which would not be necessary in an IB Economics essay – but being able to identify the different ‘shapes’ which the author colours in would be ideal if you used a lettering system (as is likely to be the case in your text book).
This video by pajholden can not be embedded, but is worth hitting the link below for a further explanation:
tariffs and protectionism by pajholden
Probably the best of the bunch, MechamDee gives us a video with quiet audio, but it is thorough, starting off with the effect of trade compared to non-trade and then moving onto the impacts of tariffs. He gets in to detail with the different ‘shapes’ as letters, although the image itself is small and not so easy to see. It is very well explained though:
These interactive presentations by http://www.reffonomics.com are particularly useful for checking your understanding:
Finally economicslessons give us a slick (and silent) animation that summarises the different effects well, but you’ll definitely want to pause this as you go along to take it in properly:
Quotas
This a particularly tricky one to revise form the internet as there are different, conflicting explanations of how a quota works in an internationally competitive market. For IB Economics, you want the diagram that shows effective supply to be a ‘kinky’ supply curve.
MechamDee gives another thorough explanation, with useful demonstration of the ‘effective’ (or ‘kinky’) supply curve.
Subsidies
What, no videos? No interactive tutorials? Sorry! Who is going to be the first to make one?
Correction: I have found an excellent video analysing the impact of a protectionist subsidy by http://welkerswikinomics.com (welkerjason):
See the full post for some accompanying questions:
Calculating the effects of protectionist subsidies – an IB HL exercise
Anyway, For additional best IB-level information on this, visit the schmidtomics link at the very top of this post, or consult your IB Economics text book!
Reasons for Trade
Sep 18th
Syllabus requirements:
Reasons for trade
• Differences in factor endowments
• Variety and quality of goods
• Gains from specialization
• Political
Higher level extension topic
• Absolute and comparative advantage (numerical and diagrammatic representations)
• opportunity cost
• limitations of the theory of comparative advantage
The first bullet points should be quite well understood by most students after a little research and careful thought.
This classic clip featuring Milton Friedman is often used as an argument for the free market, but I think it works particularly well as an argument for international (free) trade:
Power of the Market – The Pencil uploaded by LibertyPen
The Higher Level topics, particularly the concept of Comparative Advantage are trickier. However, the theory of comparative advantage is a vital argument in favour of international trade, and one well worth revising until you are confident that you understand it fully. Be sure to use diagrammatic explanations using PPFs, as well as numerical examples. Visit the following two related links in this order:
Economics Game: Ricardo, Coconuts and A Desert Island
Understanding Comparative Advantage
In addition, these excellent slideshows hosted on reffonomics.com will help you, particularly with the diagrams aspect.
Distribution of Income – All in One Go
Sep 15th
In just one post, I include resources for the section of the IB Eco syllabus (2005 version) called 3.6 Distribution of Income.
The topic includes the following points:
• Direct taxation
• Indirect taxation
• Progressive taxation
• Proportional taxation
• Regressive taxation
• Transfer payments
Higher level extension topics
• Laffer curve
• Lorenz curve and Gini coefficient
Use the following resources to learn about these sub-topics:
Direct versus Indirect
Compare these two definitions:
http://en.wikipedia.org/wiki/Direct_tax
http://en.wikipedia.org/wiki/Indirect_tax
Can you explain the difference between direct and indirect tax with example taxes?
Progressive, Regressive, and Proportional Tax
ONE Massachusetts (ONEMassPPI) demonstrates the different types of taxes:
Specific Examples of Taxation
This mjmfoodie video includes specific examples of US taxes, then a section on how taxes relates to the government’s budget (which is worth understanding in general terms) and finally a section reviewing the general types of taxes.
Testing Your Understanding of Taxes
A ‘tic tac toe’ game which puts some of the above to the test but you may also need to use your common sense and a bit of guesswork. Play as two people.
Sort different types of taxes using reffonomics here.
Transfer Payments
Check wikipedia on the matter.
And there is a brief definition courtesy of BusinessDictionary.com here
This is interesting on the increasing % spent on Transfer payments in the US since 1930:
http://mjperry.blogspot.com/2011/08/chart-of-day-transfer-payments.html
Laffer Curve
by pajholden
by
Lorenz curve and Gini coefficient
Use this video by pajholden.
And this one by EconInstructor:
Or this very short one:

The Phillips Curve
Sep 14th

Be warned. This one’s quite tricky. We’ll rely heavily on the truly excellent http://www.reffonomics.com website for this topic, but these activities will be best used following some prior learning of the Phillips Curve. I like the approach that reffonomics take, it is thorough and helps to give a good recap of general ASAD macro models. This takes things to quite an advanced level though.
First, learn about (or recap) the topic by visiting this eye-catching interactive.
Second, run through this presentation and see if you give correct answers for the short series of questions.
Third, try your hand at this quiz.
Fourth, explore how different scenarios impact on the ASAD graph and the Phillips Curve Graph here.
Fifth, try 20 multiple choice questions here. Some of them are tricky, but you’ll get instant feedback at the end.
Lastly, try your hand at some of these activities here – have a go by moving the lines and A, B and C points, and then see the suggested answers. You might not understand how to do the first one or two, but when you see their animated answers you should hopefully begin to get the hang of it.
Advanced activity:
Step 1 – download this ‘free response’ worksheet and answer using good old pencil / ruler combo.
Step 2 – check your answers against these suggested answers.
Data Response Question – Unemployment
Sep 6th
For those studying IB Economics, this is a data response question which I created for the unemployment topic back in 2008, following the usual conventions and mark scheme requirements as closely as I could.

Photo: Some rights reserved by Saad.Akhtar
The text is adapted from an original article by The Times Online, but it does not appear to be hosted there anymore.
Click here for the question paper.
Click here for the mark scheme.

