Can you drastically cut UK carbon emissions by 2050?
Mar 9th

Could you take charge and organise changes in production and consumption to cut UK CO2 production in 2050 to 20% of 1990 levels?
This excellent interactive decision making exercise asks you to do just that. It has great potential in geography, economics, environmental science and more.
Interestingly, if you get it right (succeed in hitting the 20% target or lower), you can submit your ‘decisions’ and the Department of Energy and Climate Change will combine your data with all other submissions to help inform a debate about the kinds of “choices and trade-offs the United Kingdom faces to reach the 2050 emissions reduction target”.
Hit the link below:
Thanks to my friend and former colleague, Andy, for passing this my way.

The World’s Most Typical Person
Mar 7th

The world’s most typical person is male and in terms of the mode average ethnic group, is a Chinese, Han man. His age, in terms of median average is 28. The typical face shown above is built of 190 000 photos of 28 year old ethnic Han men. But as the video tells us, he won’t be the most typical person for long …
As World Population approaches 7 billion, NationalGeographic have created a brilliant infographic-style animation, complete with catchy tune and thought-provoking statistics. (There’s also a healthy qualifier in there – “typical is always relative”).
A great starter for population studies or even for discussions about global inequality, like the World Scaled Down to A Village of 100 idea. It might also have value in Theory Of Knowledge discussions of data and what we mean by ‘typical’ and ‘ethnicity’. There’s even a bit relevant to the economic concept of ‘needs and wants’ at the very end.
Packed full of cross-curricular uses, it is simply a ‘must see’.

Visualising the Iceberg Model of Culture
Mar 5th
One of my current roles in my school is to lead a group of staff who are interested in exploring the significance of interculturalism within our school community, and to explore ways of furthering intercultural education and sharing relevant best practice.
This has led me to creating the following image. It is based on work originating in the 1970s by cultural / social anthropologists and, soon after, business theorists and there are many similar images on the Internet. I wanted to create a ‘fresh’ version so that I could release it on a Creative Commons License, one that could be freely shared amongst those who find this particular model of culture useful. (Many related images seem to be copyrighted, sometimes because they have used a copyrighted image of an iceberg).
The idea of culture as an iceberg is simple but powerful when reflecting on how a school could actively promote intercultural education. We readily identify with the more ‘visible’ and ‘obvious’ aspects of culture, and so recognise where we celebrate these aspects within the school programme. However, for genuinely meaningful intercultural education to take place, the whole school community needs to reflect on and learn about the less tangible but no less important ‘invisible’ aspects as suggested below the waterline in the image below. Crucially, the cultural aspects on the visible part of the iceberg are influenced by the sub-surface values, beliefs, notions, attitudes and assumptions.
I will post the same image and related links on my school’s interculturalism blog: http://interculturalism.blogspot.com/.
Click on the image for a larger version.

 |
The image by James Penstone is licensed under a Creative Commons Attribution-NonCommercial-ShareAlike 2.0 UK: England & Wales License. |
Inspiration:
The iceberg model of culture has been arrived at through the work of many theorists, including those referenced below:
French, W., & Bell, C. (1995). Organization development. (5th Ed.). [Englewood Cliffs, NJ: Prentice-Hall International]
Hall, E. T. (1976) Beyond Culture [New York: Doubleday]
Selfridge, R., Sokolik, S. (1975) “A comprehensive view of organizational management”. MSU Business Topics, 23(1), 46-61
Weaver, G. R. (1986). “Understanding and coping with cross-cultural adjustment stress”. In Paige R. M. (Ed.), Cross-Cultural Orientation, New Conceptualizations and Applications. [Lanham, MD: University Press of America]
The World According to Facebook
Feb 24th

(Click on the image for original version).
I have only just come across this image, reported on by the BBC last December, based on a blog post by a Facebook intern. It has been produced using actual Facebook data. Each line links pairs of ‘friends’. Brighter lines indicate more ‘friends’ between two given cities.
The dark spaces, where Facebook connections are relatively absent, are as interesting to note as the bright areas where the number one social networking site has proliferated.
It calls to mind the now classic image of the Earth’s lights at night based on NASA satellite imagery, although Eastern China and Western Russia, for example, are far more luminous in that particular image …
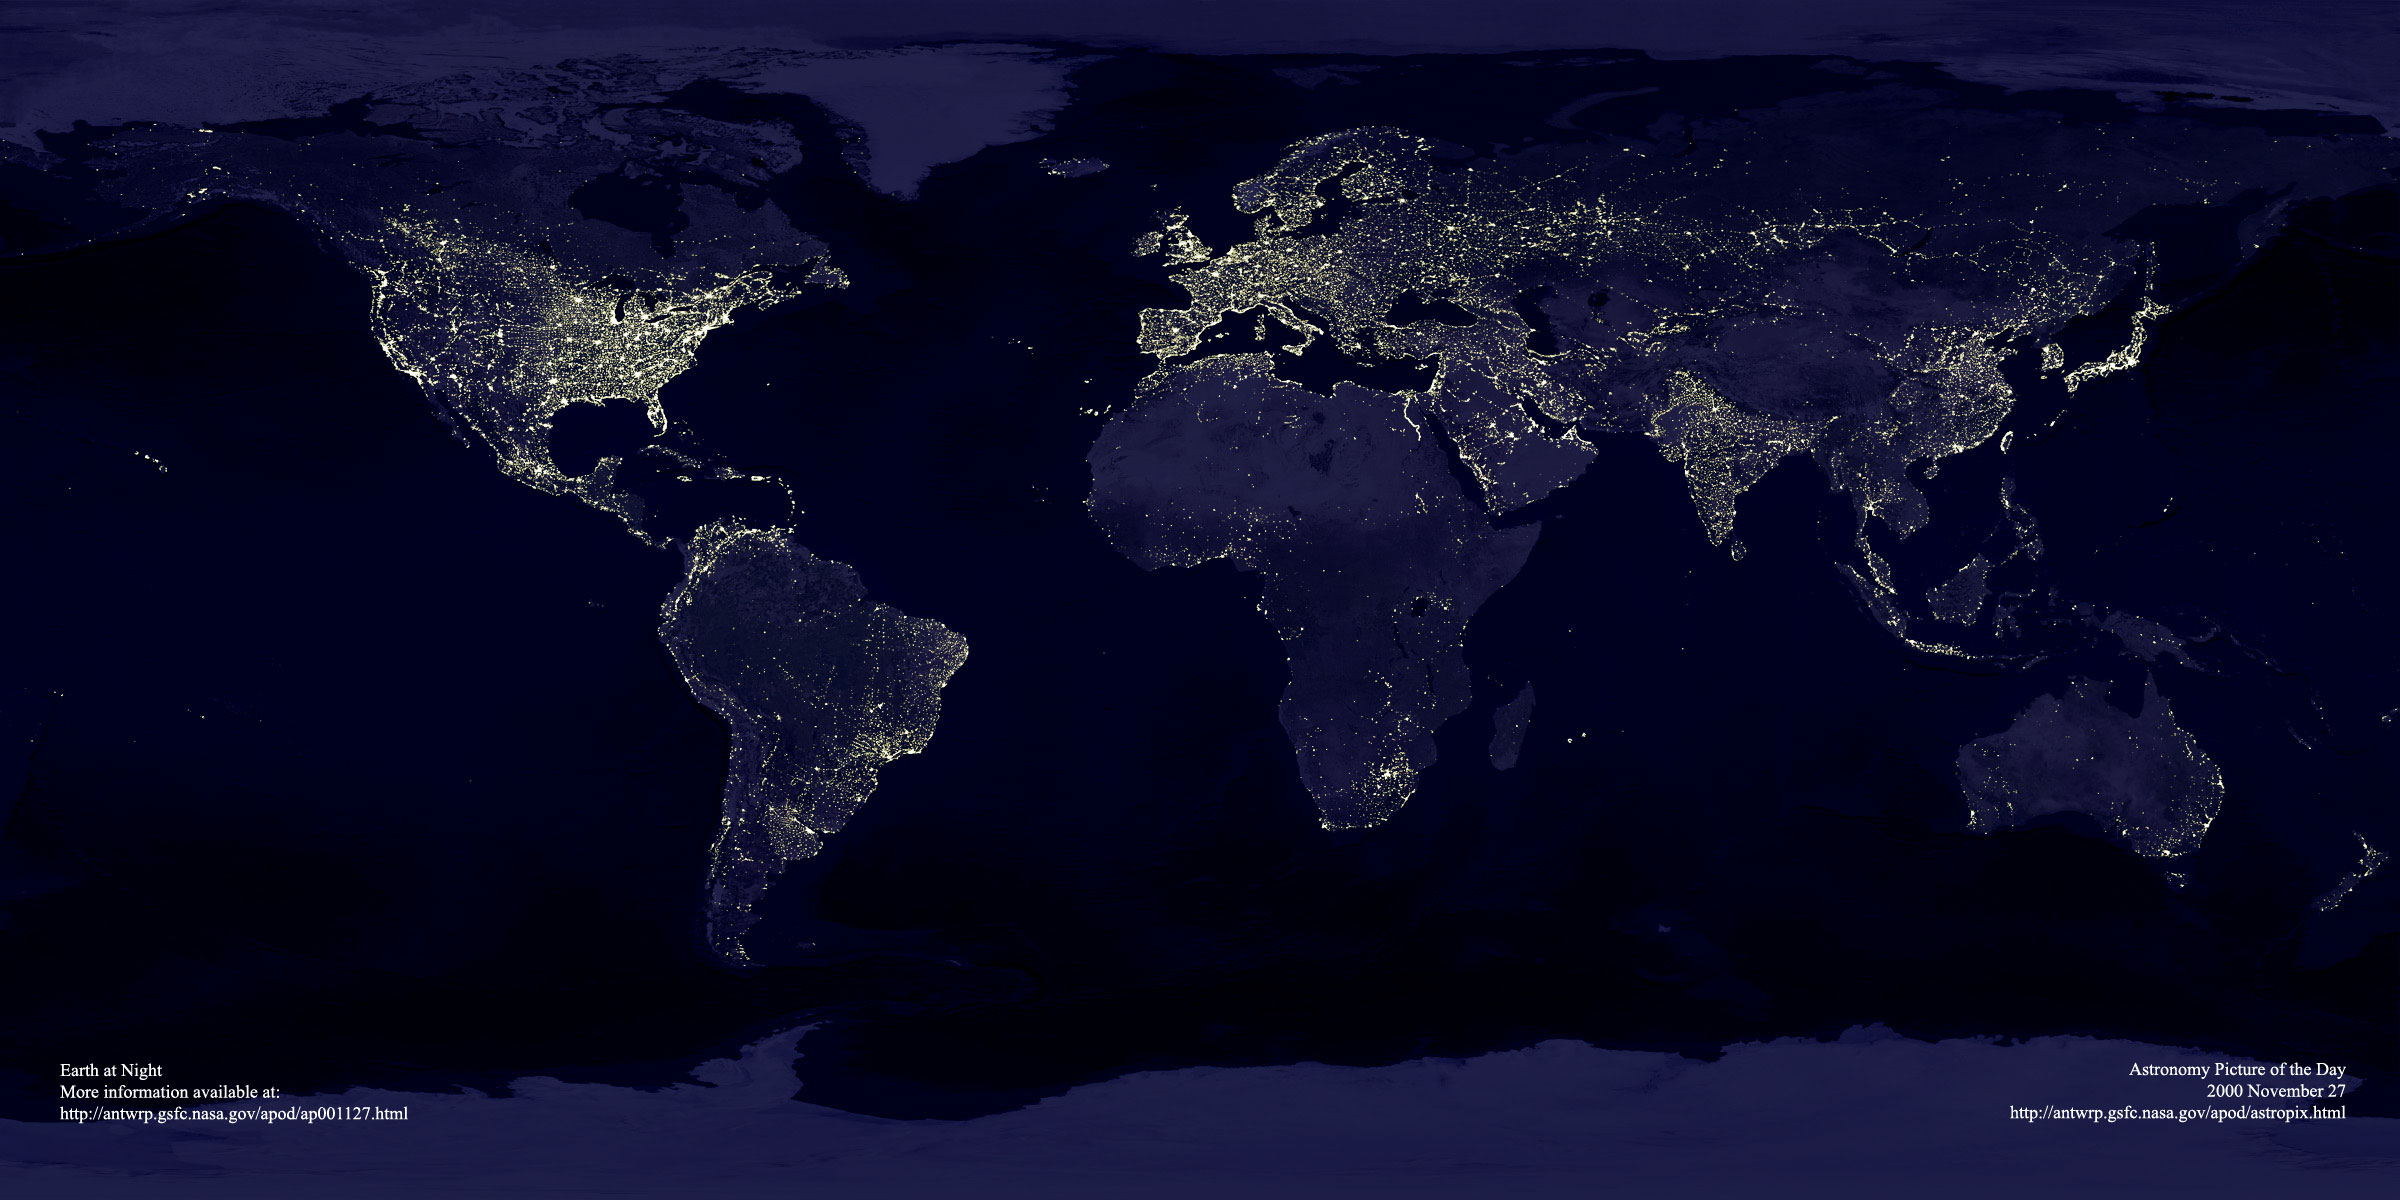
(Click on image for original version. Source: NASA)

LastPass–A Very Handy Password Manager
Dec 2nd

Image: Some rights reserved by izik
Like most people, I have more passwords for various internet sites than I can possibly remember.
For ages I have used Firefox as my main browser and set it to remember my passwords, which was a handy way to overcome my memory deficiency. You can do the same with other browsers.
From a Firefox-user’s perspective, this can be problematic: (a) you can see them pretty easily from Tools / Options / Saved Passwords and, although it is possible to lock them with a master password, my understanding is that (b) Firefox stores them in a simple text file that can easily be retrieved if you have the right know-how. This is potentially a major security problem, if for example, you lose your laptop.
The other issue with the above approach to passwords is that you have to set up your passwords across any separate computers you use. There are online syncing facilities for passwords available, such as Foxmarks. Online syncing of passwords, however, makes people understandably nervous. Having your passwords out there somewhere in the cloud feels less secure than the fact that your laptop might get stolen.
I have started using an online syncing service, however, and I think it is great: LastPass. You need to judge for yourself whether you are comfortable with online sync. I currently reserve some paranoia – I have not yet submitted my bank passwords, although that seems irrational given my understanding of how it works, and the fact that I have already submitted many key identity-linked passwords such as email accounts. I think I will move to linking bank passwords as well sometime.
You install the software on your computer. You give the software a master password which is stored locally on every computer you set it up on. The master password is needed to unlock the encrypted list of passwords which are stored online. The master password is only stored on your computer(s) when you are logged in, and even then, only after you have typed it in. (You can save it on the computer but that defeats the point.) Ultimately it stays safely in your head.
It has lots of useful features like:
- one-click sign in to sites which it recognises you have a password for
- worlks across different browsers (Internet explorer, Firefox, Chrome, etc) and different operating systems (Mac, Windows, and Linux)
- it can generate rock-solid passwords for you when you sign up to new accounts
- it can save fill-in form information for quickly filling in online forms
- there are mobile versions available
As I say, you’ll need to decide whether this idea for managing your passwords is for you, but weigh it against the approaches many people use to handle passwords (including the very vulnerable one password for all) and it soon makes a whole lot of sense.
It also comes highly recommended by some well respected organisations:
http://www.economist.com/node/15141284?story_id=15141284
http://lifehacker.com/5041463/lastpass-saves-and-syncs-passwords-between-all-your-browsers
Experiments in Online Drawings
Dec 1st
As a teacher of Economics encouraging use of collaborative tools such as Google Docs, I am keen to find a good solution for students to (co-)create drawings they can quickly access, share and publish online.
Google docs now of course has a drawing app as part of its suite of online software. This is, as far as I can tell so far, very good. I have still yet to use it with students. One of its main advantages has to be the ability to add the same sharing controls as you can on other Google Docs. I will give it a go soon.
Recently, I experimented with an alternative. Dabbleboard which in some ways still feels like the beta software it is. However it carries some advantages which I like:
- Add extra ‘pages’, effectively making a slide show of drawings (see example below)
- You can save / embed / download the end results quite easily.
- Intuitively interprets gestures – a rough line gets picked up and converted in to a neat straight line
- You can click and type text without having to select the text icon
- The controls are generally good (such as quick clone, multiple selection for grouping)
- Integrates with a tool called tokbox so you could record/video conversations in response to the drawings (I haven’t used this)
- People can join a drawing without signing up / registering – just share the email link / embed the image for others to access
Disadvantages:
- Over-sensitive interpretation of your rough gestures – drawing a curve all to easily becomes a square, for example
- Less control over editor rights – when I embedded it for access to the students so that they could take control, any ‘random’ guest visitor could take control without my knowing who – lots of fun in class, but a wider worry for who can access and edit (the embed below is locked for editing, but its a shame it is all or nothing approach).
Overall a good option for a rough and ready drawing facility that produces good results. Will experiment further with the sharing / collaborative side of things.
The World Scaled Down to A Village of 100
Nov 28th
Just came across this video, based on what is now a widely-read summary of some key demographic and economic statistics. These statistics do need to be verified, as the opening shot states, if not for any other reason than the age of the data. This notion of the world as a village of 100 (and the associated data) first emerged in the early 1990s.
As David Truss argues, this could be really useful for cross-curricular discussion. I’ve used the Village of 100 idea a few times – in Geography, Economics and as part of an assembly. I first received an email with this idea in 1998, and used some of it when visiting a Secondary School in southern Ghana in 2003. Teaching a Geography class of nearly 70 students, I tried to apply the same concept for some of the issues covered by asking the appropriate proportion of the class to stand up. The Ghanaian students were blown away by the proportion of their class that would live in Asia (having guessed Africa and Europe to carry the highest populations, by far). The ICT teacher at that school (who commanded a suite of 16 computers for a school of c. 2,500 students) was fascinated by the internet access statistic.
For another way of visualising global economic inequality (which features in the Village of 100 idea), I highly recommend this website:
Update:
This impressive and simple website helps you to make quick comparisons between your own country and any other – this can call up statistics that call to mind the inequality depicted in the Village of 100. Watch out for the adverts though:

Output or ‘Product’ in The Short Run
Nov 25th
a) Find out the definition for the short run (in Economics it has a specific definition).
Use google and the define: prefix.


Image: Some rights reserved by °Florian
b) A practical activity in the classroom.
Rules:
1) A wall in the classroom – you can not move away from the wall, you must always stay right next to the wall. Physical land is fixed.
2) At one end of the wall a desk with a pile of raw-material-paper (or text books).
3) At the other end of the wall a desk. This is where the paper is manufactured into end-of-wall paper once it has been transferred from the other side to this desk.
4) Only one piece of paper can be carried by a worker at a time.
5) We will add more and more workers, but since no-one can move away from the wall, they can not pass each other.
6) Each production cycle (period of time) lasts one minute only.
7) All workers recognise the profit-maximising incentive of working to full ability, and behave accordingly. (No slacking …)
6) First volunteer up. Results will be recorded on a Google Spreadsheet. Access the one below and make a copy of it in your Google Account.
Direct link (make a copy in your own google account): Opengecko Product Exemplified – Carrying Books Exercise
c) Make sure you have thoroughly discussed the graphs – what is happening? Why do they have these shapes?
d) Research (text book and / or web) the definitions of, behaviour of and relationship between the following as the one factor of production (labour) is increased:
- total output [total product]
- average output [average product]
- marginal output [marginal product]
Key phrase: diminishing returns (define and be precise about the full phrase)
Your ultimate aim is to be able to identify the 3 curves below and explain them:

e) Review your understanding of the above with the following videos:

#Edtech: ForgeFX Simulations – Excellent Interactive Learning Tools
Nov 24th
These online ‘immersive’ simulations by ForgeFX are brilliant, and could really help students understand some key concepts in Science, Geography, and other subjects. They require shockwave installed so that they can work in your browser.
My personal favourite is the Heifer Village : Nepal (which takes time to download as it is an entire ‘3D’ game in your browser). This could definitely be used for studying development in Geography or Economics, considering sustainable farming practices through a “a serious game that teaches players about poverty and hunger”.

Other highlights for Geography include:
Topographic Maps – dig and build a piece of relief and see how it alters the contours on a map
Earth’s Biomes – explore various biomes on a globe
Seismic Waves Training Simulation – for exploring the impact of Primary, Secondary and Surface Waves
3d Water Motion Simulator – change wind speed and watch the impact on (labelled) waves
There are good Biology simulations (explore a cow’s eye, plant and animal cell simulation, genetic drift simulation and even track an ant pheromone trail)
The 3D Solar System Simulator is very impressive.
There are a few more relevant to other disciplines – explore them here and here.

Windows Live Writer – Excellent if you Blog
Nov 24th
This is one of the programs installed on my computer that I now use the most often. It’s free to download as part of the windows live essentials suite (incidentally I don’t install any of the other programmes from that suite of software as I don’t currently have a real use for them, although Movie Maker does have its place).
I am using Live Writer right now. It is simply excellent if you use any sort of well-known blogging platform such as Blogger and WordPress (I use both for different purposes).

Why is it so good? Here are a few reasons:
- It is as simple to use as a word processor. It has a simple interface, makes the most of the screen space and is much easier to use than the usual online editors many people use for their blogs.
- It has good spell check, word count, formatting options as you might expect from a simple word processor.
- You can use it offline, and then when you have created a post, you can connect to the internet and publish.
- Once you link your blog account to it (which is straightforward), it detects your theme, categories, tags, etc. and updates when those change.
- You can link to as many blog accounts as you like and switch between them easily.
- You can drag and drop pictures in and adjust their settings quickly (including the default settings of your pictures which is itself a real time saver).
- You can paste youtube embed code in (even if you are not in the html view) and it picks it up straight away.
- Adding categories, tags, time and date posted is easy to do, and it reminds you if you haven’t.
- You can easily access previous posts and pages that have been published (it detects the list and downloads the ones you choose quickly enough). This is handy if you want to adapt them.
- It is customizable with plugins developed by a community of programmers who use this software. However I no longer use these much as Live Writer is quite often updated with internal improvements that fill the same gaps that some of the plugins used to .
- You can store draft posts and pages locally, handy if you work on some posts more gradually, coming back to them in more than one sitting.
And here’s a real bonus if you use Dropbox. I am about to go home to another computer where I will pick up the next sentence on another computer … So I’ve now picked this post up again, this time from home, because it is synced across my dropbox account. You have to set this up your self using a nifty piece of software called DirLinker and redirecting the Weblog Posts default directory (in My Documents) to a folder in Dropbox. Do this on each computer. Although it is not a straightforward a solution, it’s well worth the effort if you’d like to use Live Writer across multiple computers.

Download and info: http://explore.live.com/windows-live-writer